


.png)
Summary
Inflation is out of control.
January PCE inflation, the Fed's "preferred" inflation gauge, hits 5.4%, above expectations of 5.0%.
Core PCE inflation is now at 4.7%, also above expectations of 4.3%. If the Fed really wants to get inflation under control, they must be more aggressive. Powell pretended to be Volcker tough during Jackson Hole and then liquidity concerns spooked them in October, causing severe easing of financial conditions since then. All the hawkish talks means nothing if you in the same breath keep telling people nothing bad is going to happen. And if people start believing nothing bad is going to happen why wouldnt they pile back on risk assets?. There is no riskier situation than when there is no perceived risk at all. Is the softaling narrative coming more from the Fed or more from people wanting to will that into existence?
The Fed should raise interest rates by 50 bps in March. However, they likely won’t do this as they still think a “soft landing” is possible. With these levels of inflation, recession is always the solution. Normally a bull market never begins before the central bank´s pivot. Inflation is not going to disappear in the idyllic way the market expects, there are structural components that are uncontrollable by central banks. Unfortunately authorities will never talk to you about these issues, so they did the softlanding dance that has now led back to all this optimism that is again producing a wealth and growth effect, retail “yolo” and “meme” excess contrary to their original mission.
This month alone:
1. November CPI "revised" higher
2. December CPI "revised" higher
3. January CPI above expectations
4. January PPI above expectations
5. January PCE above expectations
6. January jobs report above expectations
Macro and news
Relevant data for this week:

Economic Update:
1. Home sales down 29% since last year. Housing prices now more unaffordable than 2008

The drop in Existing Home Sales has now surpassed the pandemic crash. It's at the lowest level since 2010

One reason buying a home has become unaffordable, mortgage payments as a percentage of income have surged past levels we saw leading up to GFC. Effectively pricing out much of a generation (or two) from the American Dream.

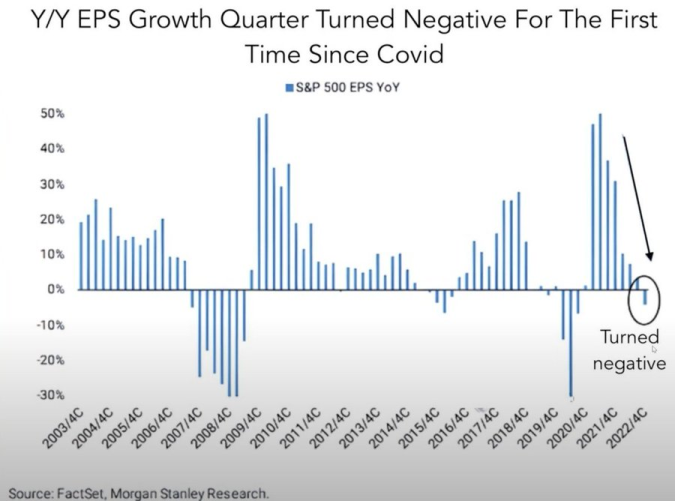
2. S&P earnings down 4.7%, largest drop since 2020

3. Credit card debt up $61 billion in Q4, largest jump since 1999

Subprime car loans in delinquency have hit a 13-year high. Another sign that lower income consumers are struggling with debt.


4. Inflation now above 2% for 22 months
January data:
US CPI 0.5% MoM, est. 0.5%, prior -0.1%, revised 0.1%
US CPI 6.4% YoY, est. 6.2%, prior 6.5%
US CPI Ex Food and Energy 0.4% MoM, est. 0.4%, prior 0.4%
US CPI Ex Food and Energy 5.6% YoY, est. 5.5%, prior 5.7%


Jan Core PCE Price Index YoY: 4.7% est. 4.3%
Jan Core PCE Price index MoM : 0.6% est. 0.4%
Jan Personal Spending MoM: 1.8% est. 1.3%

Services spending is still running strong … 3m annualized % change jumped to +10% in January

5. Net % of domestic banks tightening their lending standards has been rising rapidly and is now at levels last seen in 2000, 2008 and 2020. Loan demand continues to fall as lending standards are becoming more restrictive.


6. Fed Minutes:
- All participants supported additional balance-sheet reductions under the current plan.
- Participants agreed that restrictive monetary policy was required until the Fed was confident that inflation would fall to 2%; they also agreed that the process would likely take some time.
- Several participants advocated raising interest rates by 50 basis points.
- Some participants predicted an increase in the likelihood of a recession in 2023.
- Almost all participants at the Fed"s January 31 February meeting agreed that raising interest rates by 25 basis points was appropriate.
- Several participants stated that a protracted debt limit process in the United States could pose significant risks to the financial system and economy.
- Participants expressed high levels of uncertainty about the economy's, job market's, and inflation outlooks.
- Participants said that inflation in the last three months has eased, but they need to see more progress.
- Participants stated that the risks to the economic outlook were skewed to the downside.
- Participants stated that the continued tight job market would contribute upward pressure to inflation.
History says the Fed needs a meaningfully positive #RealFedFundsRate to slow the economy. Last week PCE data says the Real Fed Funds rate is only +5bp. More work to do.


Interest rate expectations are rising again after the Fed minutes.
The market is now seeing a 26% chance of a 50 bps rate hike in March!
There is a 28% chance that rates rise as high as 5.75% by July.
50 bps rate hikes are back on the table

Markets internals update:
- Retails are all in since the beginning of the year. Hedge funds and active managers are late but also in


- CTAs have a high level of equity exposure, with a lot more downside than upside risk to that positioning


TD Securities has $ES 3995 as a downside trigger
Citi has $ES 4004 as a sell signal for CTAs
$GS has $ES 4004 as a “notable trigger” too
CTA positioning is looking a little spooky for bulls at the moment. Since CTA’s have been aggressively buying over the past few months, they have barely any ammo left and will be forced to unload that supply in a down tape. In addition, their positioning is skewed to the downside; in an up tape, CTAs are expected to buy $5.8B worth of equities; in an up tape, CTAs are expected to sell $217B in a down tape. Therefore, the risk/reward for bulls here is very unfavorable. While it’s just one of many indicators we look at, it’s essential to remember that CTAs are a driving force in price action and should not be ignored. They’re trend followers, meaning that if the market pulls back, they’ll start selling the position they’ve accumulated over the last few months.
Watch out 4000 levels for SPX, if broken a selling tsunami could kick in!

- Record options volume: the highest ever. Record retail participation as a % of total market vol ODTE gambling is still moving the market
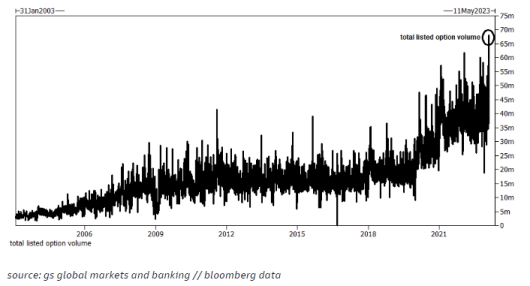


Options are now 70% of the notional value of equity traded on a daily basis vs 40% a decade ago.

- Large divergence between fixed-income markets and risky assets:
Bonds are falling like inflation is at 10% and the 10 year note yield is about to break 4%. Bond markets have been flashing warning signs for 3 weeks. Fixed income never lies
The short end of the yield curve is steadily steepening


What started out as the best January on record for fixed income has reversed to essentially zero in a few weeks.

TLT vs QQQ

LQD vs SPY


- One of the greatest short squeezes in stock market history:

After a disastrous end to 2022 for risk assets, where tax-loss selling and worsening economic data fueled a sharp market selloff, the start to 2023 couldn't be more different. Buoyant economic data, enormous liquidity injections, and bullish narratives drove an epic melt up.
This sudden shift in sentiment caused a market positioned for an imminent recession to be caught off guard, creating the false appearance of euphoria. The worst quality stocks, from bankrupt companies to those with dubious business models, defied reality and soared higher.
This set the scene for one of the greatest short squeezes in stock market history, which only exacerbated the market rally. Not only did shorts cover en masse, but the act of doing so (buying back shares and paying off a loan) added more liquidity to further fuel the melt up.
The fear of missing out then spread like wildfire. Money managers who were squeezed at the bottom started chasing the top. Others either caught off guard or were simply underweight stocks going into 2023 turned bullish and joined in. The magnitude of the rally triggered buying from the rising number of market entities, both machine and human, who bid up stocks regardless of price or fundamentals. The decreased levels of volatility in bonds and stocks created an additional self-fulfilling loop of buying.
These are the data and metrics we face, is the market correctly discounting a softlanding and an imminent fed pivot, the answer is obvious. As Keynes said the markets can stay irrational longer than you can stay solvent. More than ever, sanity and logic must prevail.
Cryptos: spot, derivatives and “on chain” metrics
During this last week the crypto ecosystem has not received more high-impact news from the hand of the regulator, although as we already know, the start of 2023 comes marked by a clear change of stance. We review what has happened since the beginning of the year:
- Binance to suspend USD bank transfers
- Paxos to stop issuing dollar-pegged Binance token BUSD
- Sec to sue Paxos for listing BInance USD stablecoin
- Kraken is under investigation by the US SEC
- Kraken agreed to shutter US crypto-staking operations
- Gemini, Genesis reach $100M agreement over Earn program
- DCG sells shares in Grayscale as it seeks to raise funds
- Revolut launches crypto staking for UK and EEA customers
- Tether (unaudited stablecoin) reports $700 million Q4 net profit in latest report
Other relevant news:
- Mastercard to allow crypto payments in Web3 via USDC settlements
- Ankr partners with Microsoft to offer enterprise node services
- Bosch and Fetch.AI launch 100M $ foundation to fuel Web3 adoption
- Hong Kong plans to lift ban on retail crypto trading
- Huobi, Gate, OKX and others have applied for licenses of Hong Kong exchanges
- Uniswap has announced buyers can purchase NFTs with any ERC20 token
- Arbitrum surpasses Ethereum mainnet in daily transactions
- Ethereum Shanghai upgrade scheduled on testnet for Feb 28
- Google Cloud to become validator on Tezos Network
- Spotify is testing token enabled music playlists
- Sec objects to Binance.US $%%1B Voyager deal
Bitcoin 13/02/23

Bitcoin 27/02/23

The market after crossing the entire main value area and testing the relevant previous highs has retraced and corrected as we expected to the value area High. After this retracement, there has been no more demand continuation, establishing the $25,000 as a strong resistance for the market.
This is reflected in the order book, in this case of binance spot, btc/usdt. It shows a large wall of limit orders in the area of $ 24300 to $ 25000.

Moving down the timeframe to analyze this area in detail, we observe how the market has failed in bearish imbalance but at the same time has failed in bullish imbalance. This bullish failure has left a potential distributive structure. Buyers in the short term should hold the market above the prominent VPOC of $23,000. Any break and test inside this level could trigger significant selling, clearly the level to watch.

We observe a strong inflow of Bitcoins on the exchanges, which could potentially exert selling pressure.

Analyzing Binance perpetual futures we clearly observe a loss of buying momentum v and a very noticeable market selling pressure (delta) during the last week 23000$ are important, but in this chart we see the importance of 20500-21500 as the last support. For long continuations we want to see this selling pressure subside in the $23000 area and ultimately at the 20500-21500$ support.

The skew, which measures the difference between the IV (implied volatility) of OTM puts and the IV of OTM calls is moving away from the buying and greed climax zone, the market seems to be starting to demand puts and selling calls.
skew 13/02/23

skew 27/02/23

The time structure of the volatility has stopped reflecting the fear of the FED event and inflation data and is back to a normal curve situation.
13/02//23

27/02/23

It is of vital importance for all risky assets to closely follow the evolution of the yield curve stress. We will closely follow the evolution of the SPX, which, once opex is overcome, is immersed in the famous weakness window, where the flows coming from the options market exert less influence, leaving the market to move more freely. It is now in this weakness window where the market must prove that it is capable of consolidating this crazy start to the year. Losing the 4000-3950 point zone for the SPX could have severe consequences for all risk assets.
Classic markets
13/02/23

27/02/23

As we have already warned in previous newsletters, the 4150-4200 gamma call has acted as a rock resistance. Once Opex was overcome, the temporary support at 4100 has disappeared, precipitating the market to enter into a negative gamma regime. We could say that the market has had a clear failure of bullish imbalance and return to value. If it loses the 4000-3950 zone, the sell-off could accelerate even more.
CTAs and vol funds will have a lot to say. As we already mentioned in this newsletter, the 4000 points are established as a key level. CTA positioning is looking a little spooky for bulls at the moment. Since CTA’s have been aggressively buying over the past few months, they have barely any ammo left and will be forced to unload that supply in a down tape. In addition, their positioning is skewed to the downside; in an up tape, CTAs are expected to buy $5.8B worth of equities; in an up tape, CTAs are expected to sell $217B in a down tape. Therefore, the risk/reward for bulls here is very unfavorable.
13/02/23

27/02/23

The stress in the fixed-income markets continues and is not favorable for risky assets, not to mention that the reduction in liquidity continues. Maintaining the pivot and softlanding narrative is expected to be very complicated


.png)


